ENVIRONMENTAL SCIENCES
Type of resources
Keywords
Publication year
Topics
-
This report describes the results of an extended national field spectroscopy campaign designed to validate the Landsat 8 and Sentinel 2 Analysis Ready Data (ARD) surface reflectance (SR) products generated by Digital Earth Australia. Field spectral data from 55 overpass coincident field campaigns have been processed to match the ARD surface reflectances. The results suggest the Landsat 8 SR is validated to within 10%, the Sentinel 2A SR is validated to within 6.5% and Sentinel 2B is validated to within 6.8% . Overall combined Sentinel 2A and 2B are validated within 6.6% and the SR for all three ARD products are validated to within 7.7%.
-
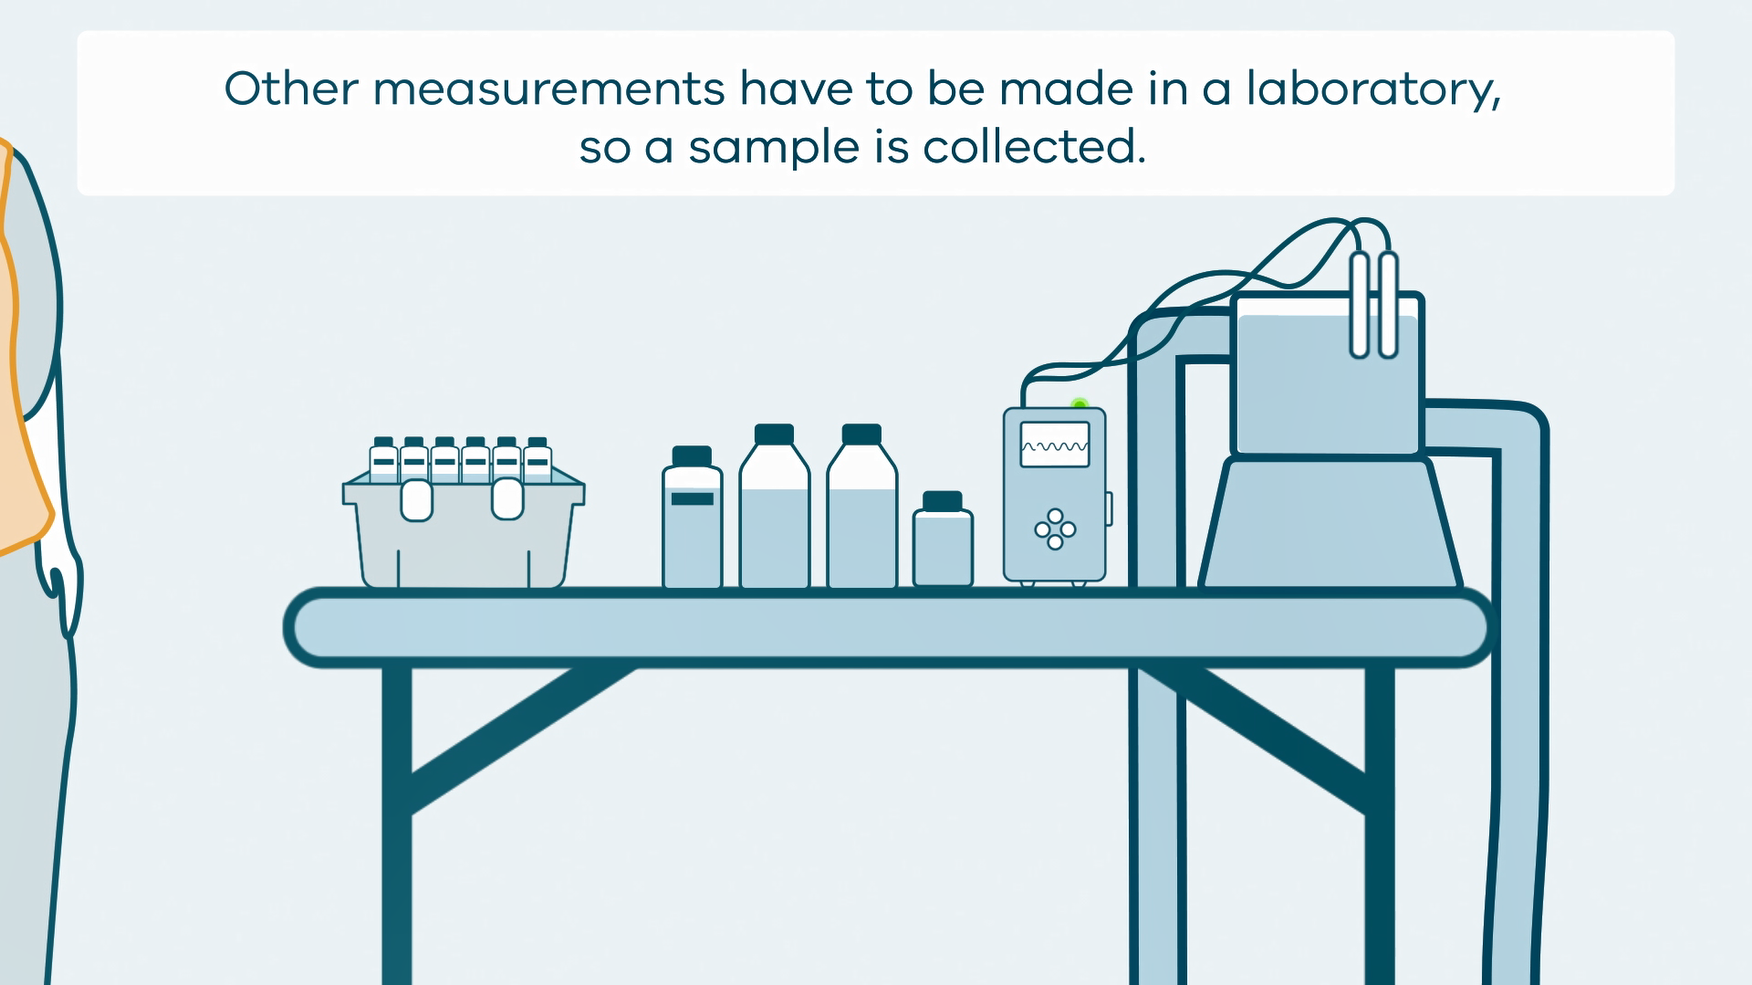
This animation shows how groundwater sampling is conducted. It is part of a series of Field Activity Technique Engagement Animations. The target audience are the communities that are impacted by GA's data acquisition activities. There is no sound or voice over. The 2D animation includes a simplified view of what groundwater sampling equipment looks like, what the equipment measures and how scientists use the data.
-
The Great Artesian Basin (GAB) covers one fifth of Australia and is the largest groundwater ‘basin’ on the continent. Groundwater from the GAB is a vital resource for pastoral, agricultural and extractive industries, underpinning at least $12.8 billion in economic activity annually, as well as providing town water supplies and supporting environmental and cultural values. The Australian Government, through the National Water Infrastructure Development Fund – Expansion, commissioned Geoscience Australia to undertake the project ‘Assessing the Status of Groundwater in the Great Artesian Basin’. A key deliverable of this project is a water balance (for 2019) encompassing the main aquifers of the GAB. To facilitate this outcome, a range of tools and techniques to assist in the development of improved hydrogeological conceptualisations of the GAB have been developed and assessed. This report presents the results of investigations from a pilot study area in the northern Surat Basin, Queensland, with components of the work extending into the wider GAB. The results demonstrate that the application of existing and new geoscientific data and technologies has the potential to further improve our understanding of the GAB hydrogeological system thus supporting the responsible management of basin water resources. Groundwater recharge potential within the GAB intake beds has been investigated using techniques that consider variations in physical and environmental characteristics. Empirical modelling assessing deep drainage as a recharge proxy suggests that, with isolated exceptions, diffuse recharge potential is generally low across most of the study area. The spatial variability in recharge potential can assist in the interpretation and/or interpolation of estimates derived from other techniques, such as chloride mass balance. The results of machine learning modelling suggest that further work is needed to better constrain uncertainty in input and training datasets, and in the development of robust translations of outputs to hydrogeologically meaningful products. The chloride mass balance (CMB) method remains the most appropriate tool for estimating long-term mean gross recharge to GAB aquifers in the northern Surat Basin. New upscaling methods provide significant improvements for mapping regional scale groundwater recharge rates and quantifying uncertainties associated with these estimates. Application of multiple techniques to the assessment of groundwater flow and recharge processes is necessary to complement CMB recharge estimates, and reduce associated uncertainty. Analysis of groundwater environmental tracers are recommended for constraining CMB recharge rates. Integrated geological assessments using airborne electromagnetic data in conjunction with other geophysical and geological data (e.g., reflection seismic, wells) are effective at characterising aquifer architecture to better understand geometry, flow pathways and structural controls relevant to recharge and connectivity at local to regional scales. Significant effort has gone into updating the regional geological framework at the whole-of-GAB scale, combining legacy and new data with recent knowledge to revise the hydrogeological conceptualisation of the GAB. This assists in constraining interpretations of regional depositional architecture and lithological heterogeneity within hydrogeological units, particularly those properties that influence groundwater storage and flux. Assessment of lateral and vertical heterogeneity of hydraulic properties within and between aquifers and aquitards in the northern Surat Basin has refined our understanding of potential groundwater connectivity and compartmentalisation. This study provides an improved hydrogeological framework to support revised water balance estimates for the GAB, and insights into potential recharge variability that may impact those input components. Targeted examples from the northern Surat Basin demonstrate the application of the techniques and tools employed, including methods to reduce uncertainty. The outcomes of this work underpin a revised hydrogeological conceptualisation for the GAB, a standardised basis for establishing future investigations, and a framework for more informed water management decision-making.
-
Background Wetlands provide a wide range of ecosystem services including improving water quality, carbon sequestration, as well as providing habitat for fish, amphibians, reptiles and birds. Managing wetlands in Australia is challenging due to competing pressures for water availability and highly variable climatic settings. The Wetlands Insight Tool (Ramsar Wetlands) has been developed to provide catchment managers, environmental water holders, andwetlands scientists a consistent historical baseline of wetlands dynamics from 1987 onwards. The Wetlands Insight Tool (Ramsar Wetlands) is available online through the DEA Mapswebsite. The Ramsar Wetlands of Australia Dataset is available under a Creative Commons Attribution 3.0 Australia Licence. We created individual wetland polygons from the multipart Ramsar polygons in the dataset. The 6 Australian Ramsar Sites in external territories are excluded as they are outside of Australia’s satellite data footprint. What this product offers The Wetlands Insight Tool (Ramsar Wetlands) summarises how the amount of water, green vegetation, dry vegetation and bare soil varies over time within eachwetland boundary.It provides the user with the ability to compare how the wetland is behaving now with how it has behaved in the past. This allows users to identify how changes in water availability have affected the wetland.It achieves this bypresentinga combined view of Water Observations from Space (DEA Water Observations), Tasseled Cap Wetness (DEA Wetness Percentiles) and Fractional Cover (DEA Fractional Cover) measurements from the Landsat series of satellites, summarised as a stacked line plot to show how that wetlandhas changed over time.
-
This flythrough highlights shallow and mesophotic seabed environments of Elizabeth and Middleton Reefs, located within the Lord Howe Marine Park. These reefs are unique because they are the southern-most platform reefs in the world and host a diverse range of tropical, sub-tropical and temperate marine species. High-resolution multibeam bathymetry data and seafloor imagery used in this flythrough was acquired by the Marine Biodiversity Hub, during the period 31 January to 6 February 2020 on board the Australian Maritime College vessel, TV Bluefin. Participating agencies included Geoscience Australia, the Institute for Marine and Antarctic Studies (University of Tasmania), the Australian Centre for Field Robotics (University of Sydney) through their involvement with the Integrated Marine Observing System (IMOS), NSW Department of Primary Industries and Parks Australia. The specific aim of the survey was to fill knowledge gaps on the distribution, extent and structure of seabed habitats and associated sessile and mobile fauna in the lagoon and mesophotic shelves of Elizabeth (Recreational Use Zone) and Middleton (National Park Zone) Reefs, using a suite of national standard survey tools and best practice sampling procedures. Data acquisition for the project included seabed mapping using multibeam sonar (Kongsberg EM 2040C HD, 300 kHz), seabed imagery acquisition by Autonomous Underwater Vehicles (AUV Sirius and AUV Nimbus), sediment samples, and imagery of demersal fish communities by stereo-baited remote underwater videos (stereo-BRUVs). This work was undertaken by the Marine Biodiversity Hub, a collaborative partnership supported through funding from the Australian Government’s National Environmental Science Program (NESP), and Parks Australia. AUV data was sourced from Australia’s Integrated Marine Observing System (IMOS) – IMOS is enabled by the National Collaborative Research Infrastructure Strategy (NCRIS). It is operated by a consortium of institutions as an unincorporated joint venture, with the University of Tasmania as Lead Agent. This multimedia product is published with the permission of the CEO, Geoscience Australia.
-
Fresh groundwater stored in Australian coastal aquifers is an important resource for humans and the natural environment. Many Australian coastal aquifers are vulnerable to seawater intrusion (SWI)—the landward encroachment of sea water into coastal aquifers—which can significantly degrade water quality and reduce freshwater availability. The increasing demands for fresh water in coastal areas and the anticipated impacts of climate change (such as sea-level rise and variations in rainfall recharge) may result in increases in the incidence and severity of SWI. Comprehensive investigations of SWI are relatively uncommon and the extent of monitoring and investigations specific to SWI are highly variable across the nation. In response to the threat posed by SWI, Geoscience Australia and the National Centre for Groundwater Research and Training, in collaboration with state and territory water agencies, undertook a national-scale assessment of the vulnerability of coastal aquifers to SWI. This assessment identified the coastal groundwater resources that are most vulnerable to SWI, including future consequences of over-extraction, sea-level rise, and recharge–discharge variations associated with climate change. The study focused on assessing the vulnerability of coastal aquifers to the landward migration of the freshwater–saltwater interface, rather than surface waterbodies.
-
This report presents geoscientific advice for the management of Antarctic Specially Protected Area (ASPA) No. 143, Marine Plain in the Vestfold Hills, East Antarctica. The advice is based on expert field observations and Remotely Piloted Aircraft (RPA) imagery of the ASPA as well as a review of observations and reports from previous visitors and scientific literature on human disturbance in polar environments. This report builds on an earlier report (McLennan 2017) which was written prior to any site visits by Geoscience Australia scientists. The advice addresses questions raised by the Australian Antarctic Division regarding the ASPA management plan, particularly relating to access via foot and helicopter, and the condition of two fossil sites. Key assumptions include that the rate of visitors to Marine Plain in the next decade will remain low and that the remaining faunal fossil specimens will stay in place. If there is a large increase in visitor numbers to Marine Plain or the fossil fauna are intended to be removed, further advice should be sought about the impacts to Marine Plain values.
-
The Exploring for the Future program Showcase 2022 was held on 8-10 August 2022. Day 2 (9th August) included talks on two themes moderated by Marina Costelloe. Data and toolbox theme: - Data acquisition progress - Dr Laura Gow - Quantitative tool development: HiQGA.jl and HiPerSeis - Dr Anandaroop Ray - Data delivery advances: Underpinned by careful data curation - Mark Webster Geology theme: - Mapping Australia's geology: From the surface down to great depths - Dr Marie-Aude Bonnardot - Towards a national understanding of Groundwater - Dr Hashim Carey - Uncovering buried frontiers: Tennant Creek to Mount Isa - Anthony Schofield and Dr Chris Carson - Lithospheric characterisation: Mapping the depths of the Australian tectonic plate - Dr Marcus Haynes You can access the recording of the talks from YouTube here: Showcase Day 2 – Part 1 https://youtu.be/US6C-xzMsnI Showcase Day 2 – Part 2 https://youtu.be/ILRLXbQNnic
-
The AEM method measures regolith and rocks' bulk subsurface electrical conductivity, typically to a depth of several hundred meters. AEM survey data is widely used in Australia for mineral exploration (i.e. mapping undercover and detection of mineralisation), groundwater assessment (i.e. hydro-stratigraphy and water quality) and natural resource management (i.e. salinity assessment). Geoscience Australia (GA) has flown Large regional AEM surveys over Northern Australia, including Queensland, Northern Territory and Western Australia. The surveys were flown nominally at 20-kilometre line spacing, using the airborne electromagnetic systems that have signed technical deeds of staging with GA to ensure they can be modelled quantitatively. Geoscience Australia commissioned the survey as part of the Exploring for the Future (EFTF) program. The EFTF program is led by Geoscience Australia (GA), in collaboration with the Geological Surveys of the Northern Territory, Queensland, South Australia and Western Australia, and is investigating the potential mineral, energy and groundwater resources in northern Australia and South Australia. We have used a machine learning modelling approach that establishes predictive relationships between the inverted flight-line modelled conductivity with a suite of national environmental and geological covariates. These covariates include terrain derivatives, gamma-ray radiometric, geological maps, climate derived surfaces and satellite imagery. Conductivity-depth values were derived from a single model using GA's deterministic 1D smooth-30-layer layered-earth-inversion algorithm. (Brodie and Richardson 2015). Three conductivity depth interval predictions are generated to interpolate the actual modelled conductivity data, which is 20km apart. These depth slices include a 0-50cm, 9-11m and 22-27m depth prediction. Each depth interval was modelled and individually optimised using the gradient boosted tree algorithm. The training cross-validation step used label clusters or groups to minimise over-fitting. Many hundreds of conductivity models are generated (i.e. ensemble modelling). Here we use the median of the models as the conductivity prediction and the upper and lower percentiles (95th and 5th) to measure model uncertainty. Grids show conductivity (S/m) in log 10 units. Reported out-of-sample r-squares for each interval in order of increasing depth are 0.74, 0.64, and 0.67. A decline in model performance with increasing depth was expected due to the decrease in suitable covariates at greater depths. Modelled conductivities seem to be consistent with the geological, regolith, geomorphological, and climate processes in the study area. The conductivity grids are at the resolution of the covariates, which have a nominal pixel size of 85 meters. Datasets in this data package include; 1. 0-50cm depth interval 0_50cm_median.tif; 0_50_upper.tif; 0_50_lower.tif 2. 9-11m depth interval 9_11m_median.tif; 9_11m_upper.tif; 9_11m_lower.tif 3. 22-27m depth interval 22_27_median.tif; 22_27_upper.tif; 22_27_lower.tif 4. Covariate shift; Cov_shift.tif (higher values = great shift in covariates) Reference: Ross C Brodie & Murray Richardson (2015) Open Source Software for 1D Airborne Electromagnetic Inversion, ASEG Extended Abstracts, 2015:1, 1-3, DOI: 10.1071/ ASEG2015ab197
-
The values and distribution patterns of the strontium (Sr) isotope ratio 87Sr/86Sr in Earth surface materials is of use in the geological, environmental and social sciences. Ultimately, the 87Sr/86Sr ratio of any mineral or biological material reflects its value in the rock that is the parent material to the local soil and everything that lives in and on it. In Australia, there are few large-scale surveys of 87Sr/86Sr available, and here we report on a new, low-density dataset using 112 catchment outlet (floodplain) sediment samples covering 529,000 km2 of inland southeastern Australia (South Australia, New South Wales, Victoria). The coarse (<2 mm) fraction of bottom sediment samples (depth ~0.6-0.8 m) from the National Geochemical Survey of Australia were fully digested before Sr separation by chromatography and 87Sr/86Sr determination by multicollector-inductively coupled plasma-mass spectrometry. The results show a wide range of 87Sr/86Sr values from a minimum of 0.7089 to a maximum of 0.7511 (range 0.0422). The median 87Sr/86Sr (± robust standard deviation) is 0.7199 (± 0.0112), and the mean (± standard deviation) is 0.7220 (± 0.0106). The spatial patterns of the Sr isoscape observed are described and attributed to various geological sources and processes. Of note are the elevated (radiogenic) values (≥~0.7270; top quartile) contributed by (1) the Palaeozoic sedimentary country rock and (mostly felsic) igneous intrusions of the Lachlan geological region to the east of the study area; (2) the Palaeoproterozoic metamorphic rocks of the central Broken Hill region; both these sources contribute fluvial sediments into the study area; and (3) the Proterozoic to Palaeozoic rocks of the Kanmantoo, Adelaide, Gawler and Painter geological regions to the west of the area; these sources contribute radiogenic material to the region mostly by aeolian processes. Regions of low 87Sr/86Sr (≤~0.7130; bottom quartile) belong mainly to (1) a few central Murray Basin catchments; (2) some Darling Basin catchments in the northeast; and (3) a few Eromanga geological region-influenced catchments in the northwest of the study area. The new spatial dataset is publicly available through the Geoscience Australia portal (https://portal.ga.gov.au/restore/cd686f2d-c87b-41b8-8c4b-ca8af531ae7e).